History Says the Bear Market May be Coming to an End, but the Yield Curve Says Otherwise: Market Commentary from Cabana’s CEO – July 14, 2023  

10 months ago

  • Share this:

I hope everyone is enjoying some summertime and got to be with family over the July 4th holiday last week. Nothing is more important. 

This week we got some good news on the inflation front, as both the consumer price index and producers price index came in lighter than forecast. We are also continuing to see market breadth improve and the equal weight S&P 500 is beginning to outperform the market cap weighted version that we see published all over television and other forms of financial media. If you read my commentaries often, you know that I am much more interested in the equal weight version because it is more representative of the overall economy, rather than a limited few giant technology companies. At Cabana, our portfolios are diversified and as such, we want to know about all the various sectors of the economy. I have included a chart (Chart 1) below of the relative performance of the equal weight S&P 500 vs. the market cap weighted version (RSP vs. SPY). This chart goes back to the COVID bear market in March 2020 and continues through July 13, 2023. As you can see, RSP led the way out of that bear market and continued to lead up until the middle of 2021. It was during this 15-month period that we saw the bulk of stock gains, which ended in January 2022.  

Another chart (Chart 2), which is also below, shows the absolute performance of RSP over the same time frame. You can see that the broad stock market began to peak at the same time as its relative performance vs SPY. This tells us that a bunch of companies’ stock began churning in the middle of 2021, despite big tech continuing to push the market cap weighted indices higher and higher for another six months.  

We all know what happened next – and it is revealed in these charts as well. Technology (and by proxy the market cap weighted SPY) got crushed, as interest rates exploded in early 2022. The equal weight index didn’t have as far to fall because it hadn’t seen the same gains since the middle of 2021. This year has seen a massive rebound limited primarily to those big technology companies that ended 2022 down 30-50%. The rest of the market is still playing catch-up and that is what we are seeing now. Some much needed catch-up.  

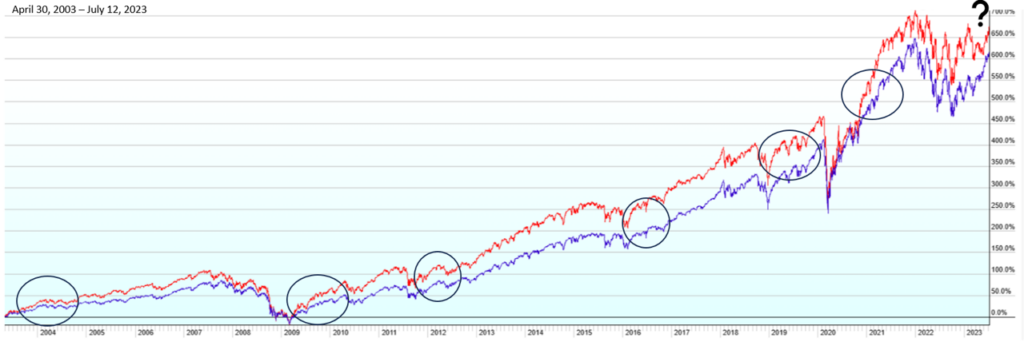
So, why am I so interested in this relative performance issue? Because we have been in a bear market since the beginning of 2022 and history tells us the equal weight index leads the way out of bear markets. And this history is not limited to the last one we saw in 2020. Chart 3 below shows the relative performance of RSP vs SPY since 2003. RSP conclusively outperformed coming out of each bear market we have seen this century (as well as other significant corrections). This includes the 2000-2003 tech bubble, the 2007-2009 financial crisis, corrections in 2011, 2015 and 2018, and the COVID bear market in 2020. I will feel a lot more confident when we see RSP break above the highs established in 2021. 

Chart 1: RSP v. SPY Performance Since 2020 

Source: Investopedia.com; as of July 10, 2023 

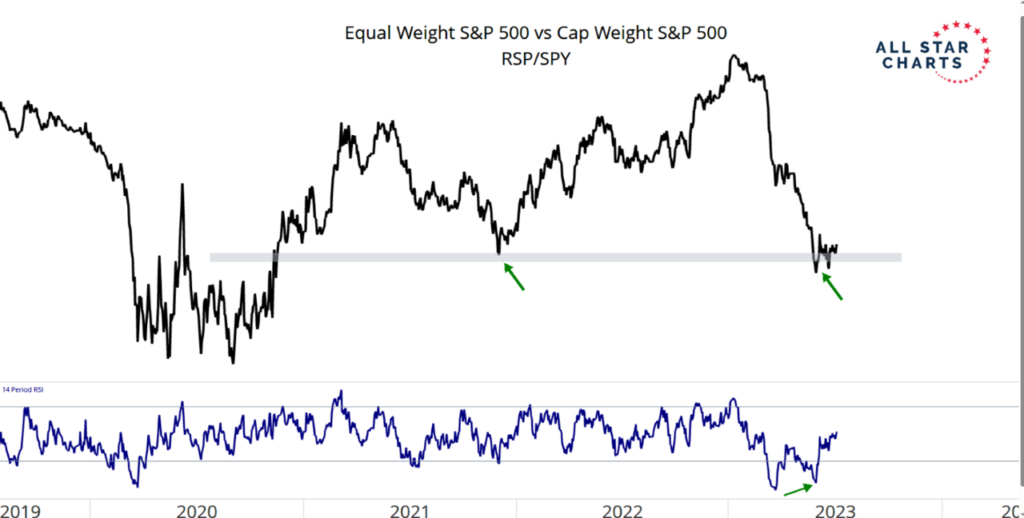
Chart 2: RSP Absolute Performance Since 2020 

Source: Stockcharts.com; July 2019-July 13, 2023 

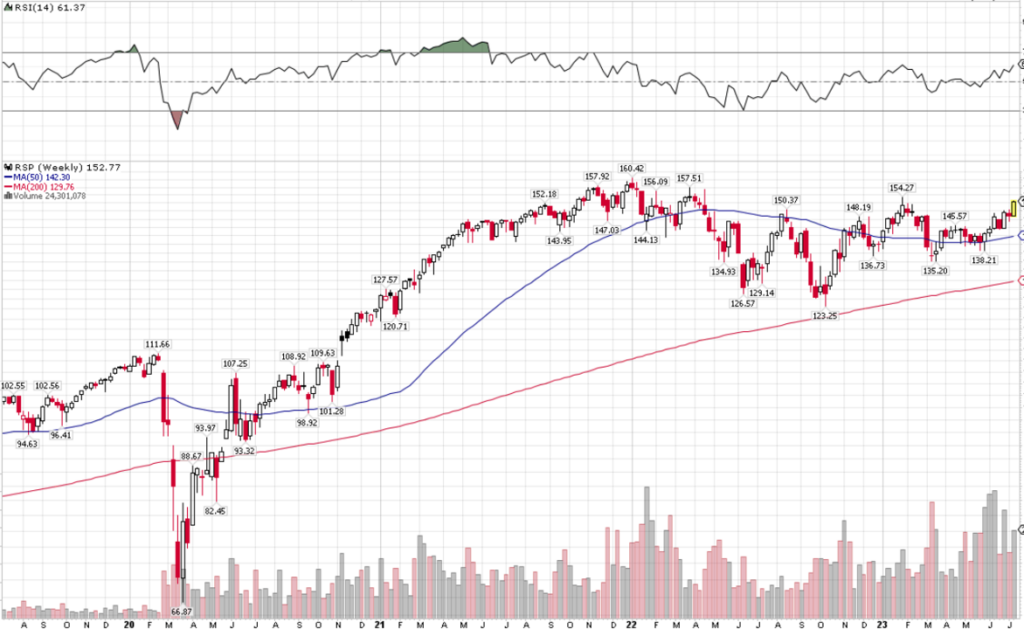
Chart 3: RSP v. SPY Performance Since 2003 

Source: Stockcharts.com 

While I am more hopeful every day in what we are seeing in stocks, it remains a fact that the yield curve is severely inverted and objective economic indicators suggest a near certainty that a recession will occur within the next year. The Confidence Board of Leading Economic Index (LEI) and the Federal Reserve Bank of NY Recession Probability Indicator are both deeply within territory that historically has resulted in a recession.  

This all makes forecasting very difficult and is why I believe you have to have an objective process to follow. Nobody rings a bell signaling the all clear. It is always a struggle, and this market is that and more. We have a process at Cabana and while it is by no means perfect, it is what gets me through the day to day. 

We remain in our Transitional Bearish scene (improving) having added equity exposure last month. 

Disclaimers

January 17, 2024

This material is prepared by Cabana LLC, dba Cabana Asset Management and/or its affiliates (together “Cabana”) for informational purposes only and is not intended to be relied upon as a forecast, research or investment advice, and is not a recommendation, offer or solicitation to buy or sell any securities or to adopt any investment strategy. This material may only be distributed in its original format and may not be altered or reproduced without the prior written consent of CabanaThe opinions expressed reflect the judgement of the author, are as of the date of its publication and may change as subsequent conditions vary. The information and opinions contained in this material are derived from proprietary and nonproprietary sources deemed by Cabana to be reliable, are not necessarily all-inclusive and are not guaranteed as to accuracy. As such, no warranty of accuracy or reliability is given and no responsibility arising in any other way for errors and omissions (including responsibility to any person by reason of negligence) is accepted by Cabana, its officers, employees or agents.  

“CARA” is Cabana’s Cyclical Asset Reallocation Algorithm. Scenes assigned as per the judgment of The Cabana Group. Scene names and number of scenes have changed over time in an effort to obtain efficiencies and provide clarity of investment objective. 

This material may contain ‘forward looking’ information that is not purely historical in nature. Such information may include, among other things, projections and forecasts. There is no guarantee that any forecasts made will come to pass. Reliance upon information in this material is at the sole discretion of the reader. Past performance is not a reliable indicator of current or future results and should not be the sole factor of consideration when selecting a product or strategy. All investment strategies have the potential for profit or loss. All strategies have different degrees of risk. There is no guarantee that any specific investment or strategy will be suitable or profitable for a particular client. The information provided here is neither tax nor legal advice. Investors should speak to their tax professional for specific information regarding their tax situation. Investment involves risk including possible loss of principal.  

Cabana LLC, dba Cabana Asset Management (“Cabana”), is an SEC registered investment adviser with offices in Fayetteville, AR and Plano, TX. The firm only transacts business in states where it is properly registered or is exempted from registration requirements. Registration as an investment adviser is not an endorsement of the firm by securities regulators and does not mean the adviser has achieved a specific level of skill or ability. Additional information regarding Cabana, including its fees, can be found in Cabana’s Form ADV Part 2A or Form CRS. A copy of which is available upon request or online at www.adviserinfo.sec.gov/. 

Past performance is no guarantee of future results. All investment strategies have different degrees of risk and the corresponding potential for profit or loss. Asset allocation and diversification will not necessarily improve returns and cannot eliminate the risk of investment losses. “Target Drawdown” is merely a descriptive term used to describe the general strategy and objective of the portfolio, it is not a guarantee, nor should it be construed to suggest safety or protection from loss. There is no guarantee that portfolio performance will remain consistent with the targeted drawdown parameter. While risk tolerance and targeted “drawdown” are identified on the front end for each portfolio, Cabana’s algorithm does not take any one client’s situation into account and there is no guarantee that Cabana’s strategies will be suitable for any investor. Investors and advisors should not simply rely on the name of any portfolio to determine what is suitable. It is the responsibility of investment advisors to determine what is suitable for their clients. Cabana manages assets on multiple custodial platforms. Performance results for specific investors will vary based upon differences in associated costs and asset availability.  

Cabana claims compliance with the Global Investment Performance Standards (GIPS®). GIPS® is a trademark of the CFA Institute. The CFA Institute does not endorse or promote this organization, nor does it warrant the accuracy or quality of the content contained herein. To receive a GIPS Report and/or a firm’s list of composite/pooled fund descriptions please email your request to info@thecabanagroup.com.

All recommendations made in the prior 12 months are available upon request. Cabana’s allocation history is available here. For additional information regarding our services, including performance disclosures and award methodology, please visit https://thecabanagroup.com/disclaimers/. 

Commonly used index/benchmark definitions:  

All indices and categories are unmanaged and an individual cannot invest directly in an index or category. Index returns do not include fees or expenses. Benchmark indices will likely materially differ from Cabana’s portfolio strategies. Detailed information as to how the returns are calculated can be obtained online from the following link: https://thecabanagroup.com/disclaimers/performance-reporting-methodology/. 

Morningstar’s Moderate Target Risk index  follows a moderate equity risk preference and is based on well-established asset allocation methodology from Ibbotson Associates, a Morningstar company.  

Morningstar’s Tactical Allocation category includes portfolios that seek to provide capital appreciation and income by actively shifting allocations across investments. These portfolios have material shifts across equity regions, and bond sectors on a frequent basis. 

The S&P 500 Index is a market-capitalization weighted stock market index of 500 widely held large-cap stocks often used as a proxy for the U.S. stock market.  

The Russell 2000 and 3000 indices are market-capitalization weighted stock market indices that include, respectively, 2000 and 3000 of the most widely-held stocks and are often used as proxies for the U.S. stock market. 

The Nasdaq Composite Index is a market-weight capitalization index that covers more than 3,000 stocks listed on the Nasdaq Stock Market. What is the Nasdaq Composite, and What Companies are in It? | Nasdaq