Let’s Take Another Look Under the Hood… Are Things Really Improving?: Market Commentary from Cabana’s CEO – April 14, 2023

1 year ago

  • Share this:

We have spent the past couple of commentaries looking under the hood, so to speak, of the equity market in an attempt to determine if the current rally has any legs to it – or is simply the next in a series of head fakes that we have endured during the past thirteen months.  

In the first of those, I laid out what we were seeing when looking at the market cap weighted S&P 500 vs. the equal weight version. It is the market cap weighted version that pops up on your TV every day. This is true for the Dow Jones Index and the Nasdaq as well. What each of these major indices does is overweight the performance of the largest stocks versus the rest of the stocks in the index. Thus, the reported “stock market” performance is skewed towards the largest companies. This becomes a real problem when some of those companies are so much bigger than all the rest, not to mention they all are the same type of company. The companies I am talking about include Apple, Amazon, Facebook (Meta), Microsoft and Tesla. These are absolute behemoths compared to all the other companies in these indices and they are all technology type stocks (and yes, they are in multiple indices at the same time). At the end of the day, what we really want to know is how everybody is doing in the current environment. A simple way to do that is to compare the performance of the market cap weighted S&P 500 to the equal weight index where everybody’s performance counts the same. As a general rule, it is a good thing when the equal weight index is doing as well as the market cap weighted index.  

The second commentary I wrote over the past month (or so) included some charts and comments from our monthly advisor webinar reflecting what I consider to be the most important engines (sectors) that drive our economy. These were real estate, financials, industrials and transports. The sum of all this analyzing was that the current rally has been on the shoulders of just a very few mega cap tech companies and that while on its face it appeared the stock market was recovering from its latest swoon, there was a huge disparity between the haves and the have nots. Equally important, the have nots were some of the most important parts of the overall puzzle.  

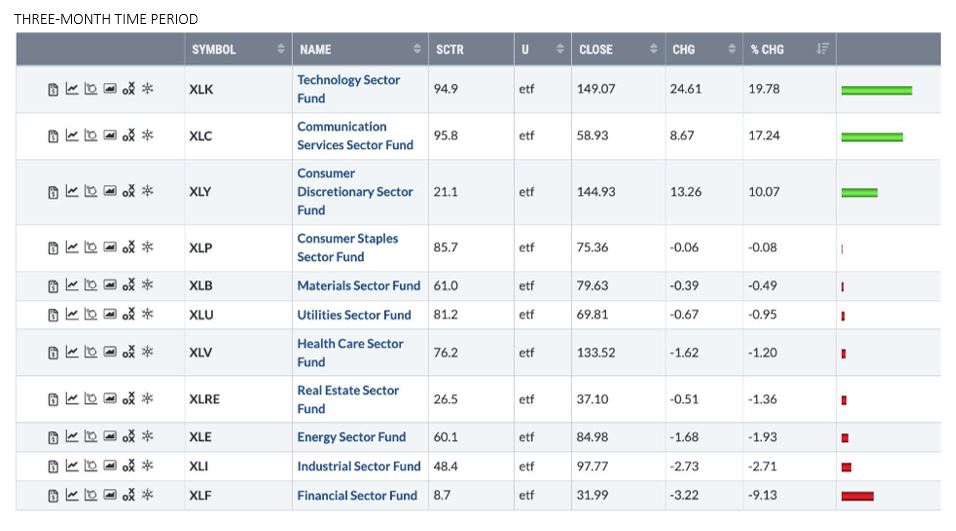
A few days after I wrote the first of those commentaries, the Wall Street Journal pointed out many of the same concerns and issues with underlying “breadth” within the rally. Maybe they read my commentary… or more likely they simply watch and read some of the same things that I do. This past weekend one of my favorite analysts, John Murphy, renowned market technician and founder of StockCharts.com wrote his weekly market message on exactly the same thing. Moreover, he provided some concise evidence via his charts to demonstrate the fact that the current positive performance in stocks has been confined to the market cap weighted index and mainly to only two sectors out of the 11 that make up the S&P 500. What were those two sectors? Technology and communication services. Both of which are made up largely of the stocks listed above. I have included Mr. Murphy’s data from last week below.  

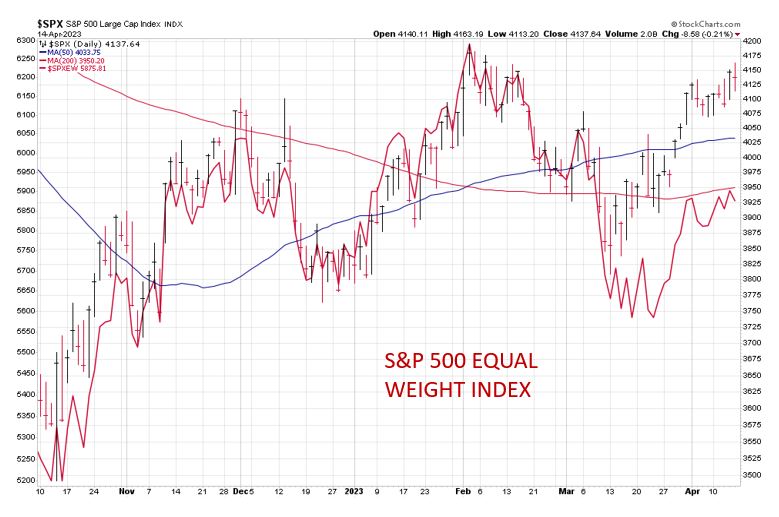
John Murphy S&P 500 Index Comparison as of April 6, 2023 

John Murphy 3-Month Sector Comparison as of April 6, 2023 

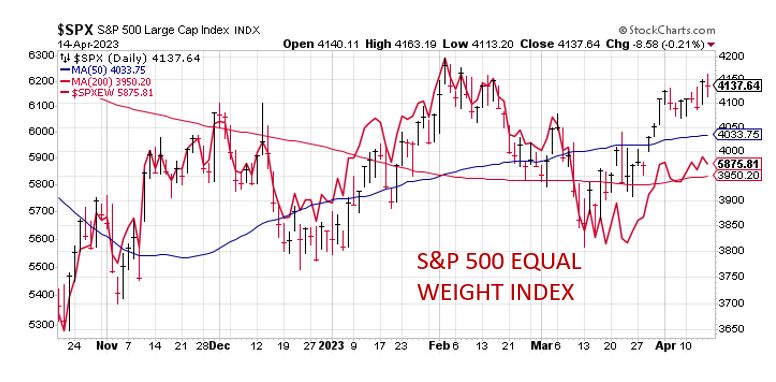
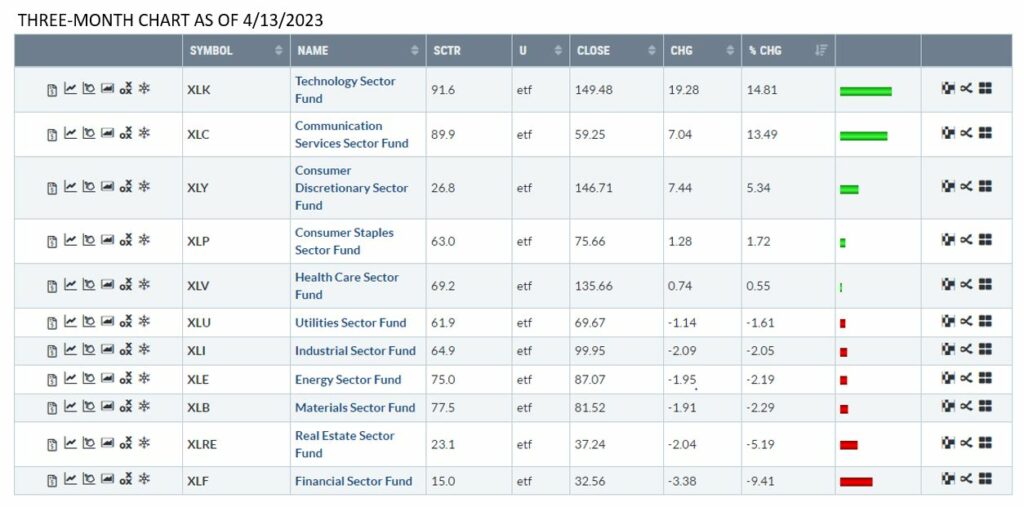
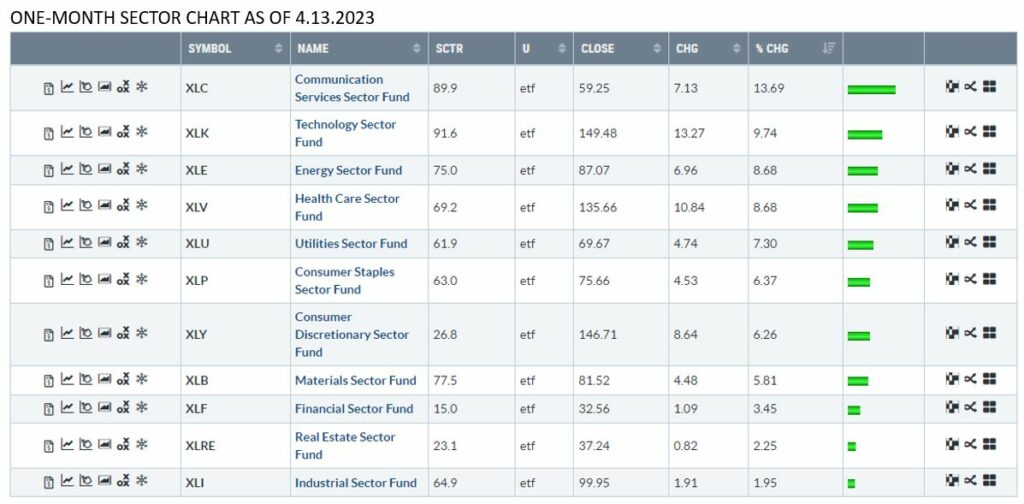
So, has anything changed over the past week to make our current situation a bit more hopeful? Well, we ran the exact same data after market close yesterday afternoon (Thursday) and lo and behold, we are seeing some improvement. The equal weight S&P 500 is starting to catch up and some other sectors are turning green, just over the past four trading days. For good measure, I ran the last chart over only the past month and we are green across the board. Even financials are getting bought. See the updated charts below. 

S&P 500 Index Comparison as of April 13, 2023 

3-Month Sector Comparison as of April 13, 2023  

1-Month Sector Comparison as of April 13, 2023 

To me, this is a good sign that we can move higher. Inflation and interest rates have likely peaked, which is a necessary condition for the next bull market to begin. The Fed has now formally acknowledged in its minutes released this week that a recession is likely. I think acknowledgement by the fed of a deteriorating economy is the first step in a pivot to start helping instead of hurting. Do we have problems ahead? Of course. And maybe very big ones. The extent of the damage done to banks and commercial real estate as well as other interest rate sensitive businesses has yet to be felt. We are also just now expecting to see signs of weakness in the broad economy. So, we are very much not out of the woods, but then again, we never are. Investing is all about finding a path through the woods – however accommodating or threatening they may be. 

At Cabana, due to improving technical conditions, we released our Safety Valve allocations and are normally allocated within our Bearish Scene. We are prepared to reallocate to add risk assets should CARA (Cabana’s Cyclical Asset Reallocation Algorithm) signal a change.

Disclaimers

January 17, 2024

This material is prepared by Cabana LLC, dba Cabana Asset Management and/or its affiliates (together “Cabana”) for informational purposes only and is not intended to be relied upon as a forecast, research or investment advice, and is not a recommendation, offer or solicitation to buy or sell any securities or to adopt any investment strategy. This material may only be distributed in its original format and may not be altered or reproduced without the prior written consent of CabanaThe opinions expressed reflect the judgement of the author, are as of the date of its publication and may change as subsequent conditions vary. The information and opinions contained in this material are derived from proprietary and nonproprietary sources deemed by Cabana to be reliable, are not necessarily all-inclusive and are not guaranteed as to accuracy. As such, no warranty of accuracy or reliability is given and no responsibility arising in any other way for errors and omissions (including responsibility to any person by reason of negligence) is accepted by Cabana, its officers, employees or agents.  

“CARA” is Cabana’s Cyclical Asset Reallocation Algorithm. Scenes assigned as per the judgment of The Cabana Group. Scene names and number of scenes have changed over time in an effort to obtain efficiencies and provide clarity of investment objective. 

This material may contain ‘forward looking’ information that is not purely historical in nature. Such information may include, among other things, projections and forecasts. There is no guarantee that any forecasts made will come to pass. Reliance upon information in this material is at the sole discretion of the reader. Past performance is not a reliable indicator of current or future results and should not be the sole factor of consideration when selecting a product or strategy. All investment strategies have the potential for profit or loss. All strategies have different degrees of risk. There is no guarantee that any specific investment or strategy will be suitable or profitable for a particular client. The information provided here is neither tax nor legal advice. Investors should speak to their tax professional for specific information regarding their tax situation. Investment involves risk including possible loss of principal.  

Cabana LLC, dba Cabana Asset Management (“Cabana”), is an SEC registered investment adviser with offices in Fayetteville, AR and Plano, TX. The firm only transacts business in states where it is properly registered or is exempted from registration requirements. Registration as an investment adviser is not an endorsement of the firm by securities regulators and does not mean the adviser has achieved a specific level of skill or ability. Additional information regarding Cabana, including its fees, can be found in Cabana’s Form ADV Part 2A or Form CRS. A copy of which is available upon request or online at www.adviserinfo.sec.gov/. 

Past performance is no guarantee of future results. All investment strategies have different degrees of risk and the corresponding potential for profit or loss. Asset allocation and diversification will not necessarily improve returns and cannot eliminate the risk of investment losses. “Target Drawdown” is merely a descriptive term used to describe the general strategy and objective of the portfolio, it is not a guarantee, nor should it be construed to suggest safety or protection from loss. There is no guarantee that portfolio performance will remain consistent with the targeted drawdown parameter. While risk tolerance and targeted “drawdown” are identified on the front end for each portfolio, Cabana’s algorithm does not take any one client’s situation into account and there is no guarantee that Cabana’s strategies will be suitable for any investor. Investors and advisors should not simply rely on the name of any portfolio to determine what is suitable. It is the responsibility of investment advisors to determine what is suitable for their clients. Cabana manages assets on multiple custodial platforms. Performance results for specific investors will vary based upon differences in associated costs and asset availability.  

Cabana claims compliance with the Global Investment Performance Standards (GIPS®). GIPS® is a trademark of the CFA Institute. The CFA Institute does not endorse or promote this organization, nor does it warrant the accuracy or quality of the content contained herein. To receive a GIPS Report and/or a firm’s list of composite/pooled fund descriptions please email your request to info@thecabanagroup.com.

All recommendations made in the prior 12 months are available upon request. Cabana’s allocation history is available here. For additional information regarding our services, including performance disclosures and award methodology, please visit https://thecabanagroup.com/disclaimers/. 

Commonly used index/benchmark definitions:  

All indices and categories are unmanaged and an individual cannot invest directly in an index or category. Index returns do not include fees or expenses. Benchmark indices will likely materially differ from Cabana’s portfolio strategies. Detailed information as to how the returns are calculated can be obtained online from the following link: https://thecabanagroup.com/disclaimers/performance-reporting-methodology/. 

Morningstar’s Moderate Target Risk index  follows a moderate equity risk preference and is based on well-established asset allocation methodology from Ibbotson Associates, a Morningstar company.  

Morningstar’s Tactical Allocation category includes portfolios that seek to provide capital appreciation and income by actively shifting allocations across investments. These portfolios have material shifts across equity regions, and bond sectors on a frequent basis. 

The S&P 500 Index is a market-capitalization weighted stock market index of 500 widely held large-cap stocks often used as a proxy for the U.S. stock market.  

The Russell 2000 and 3000 indices are market-capitalization weighted stock market indices that include, respectively, 2000 and 3000 of the most widely-held stocks and are often used as proxies for the U.S. stock market. 

The Nasdaq Composite Index is a market-weight capitalization index that covers more than 3,000 stocks listed on the Nasdaq Stock Market. What is the Nasdaq Composite, and What Companies are in It? | Nasdaq