We try to write our commentaries to incorporate timely issues that impact investing and hopefully provide some education along the way. The first quarter of this year has been a lot of reviewing the rotation out of “big tech” and into other areas of the economy. That trend continues today despite the “correction” we’re seeing in the overall stock market.
This past week, we saw both the Nasdaq 100 (QQQ) and market cap weighted S&P 500 (SPY) drop more than 10% from recent highs seen in the middle of February. The Dow (DIA) and equal weight S&P 500 (RSP) have held up better, but everything is down year to date. All those who enjoyed the run in the “Magnificent Seven” tech stocks, and the corresponding lift it gave to the market cap weighted indices, are now getting the other side of it. Inflation indicators remain elevated, which is keeping upward pressure on interest rates and as a result, bond prices are range bound. Falling rates would be helpful to offset declining stocks as the economy weakens. We aren’t getting that because there are so many unknowns with our current policymakers. The tariff back and forth makes forecasting very difficult. We have a Fed meeting this week and will hear from Chairman Powell on Wednesday. Perhaps we get some clarity on interest rates from him… but I wouldn’t count on it.
More than anything, markets and, by proxy, investors, like clarity. I have said many times internally, “just tell me what game we are playing, and I will figure out a path forward”. Right now, I am not sure anyone knows what game we are playing. So, what to do? When in doubt, look at the charts. Prices aggregate all known information into one tidy package – and that package is a chart. Right now, the charts look a lot like the beginning of 2022. See Charts 1 and 2 below. There is no guarantee that history repeats itself, but in my experience it often comes close. The best performing assets of 2022 were energy, healthcare, and utilities. How are they doing now? See Chart 3 below.
Chart 1 – SPY and QQQ from November 30, 2021 – March 17, 2022 via Stockcharts.com:
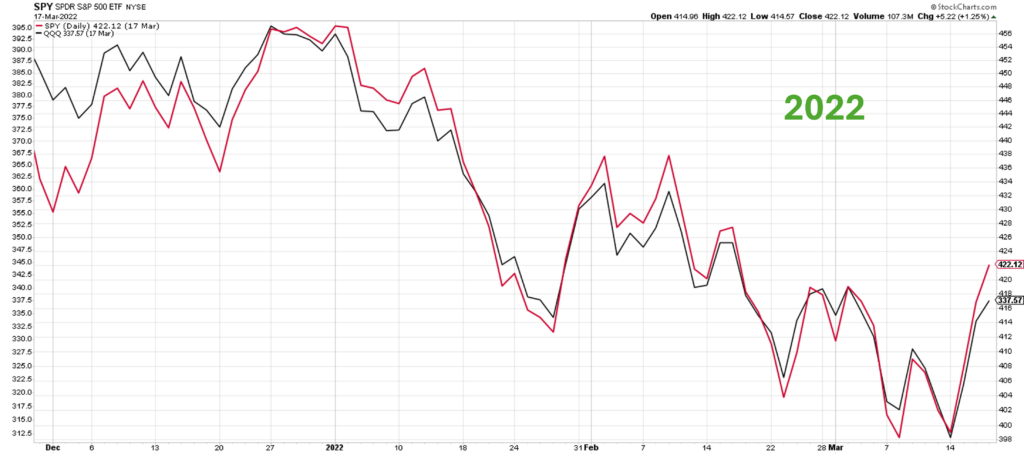
Chart 2 – SPY and QQQ from November 30, 2024 – March 17, 2025 via Stockcharts.com:
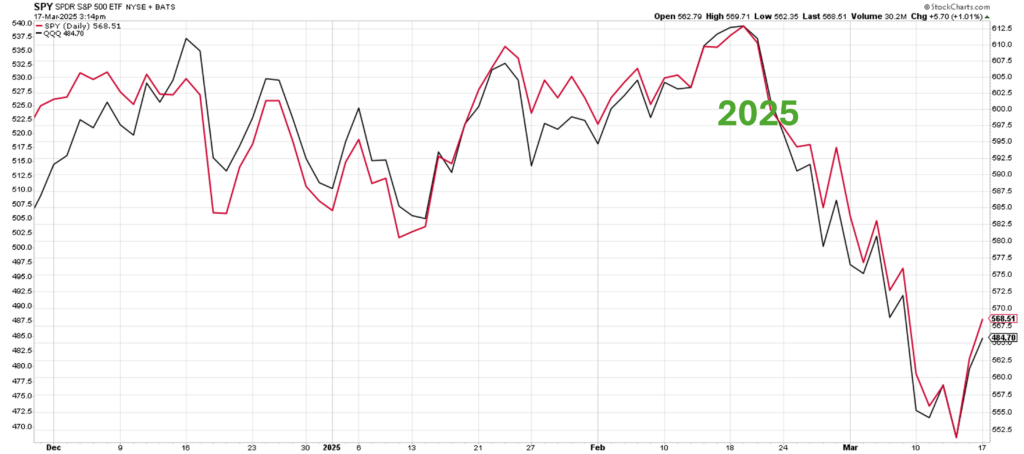
Chart 3 – Performance by Sector from December 31, 2024 – March 14, 2025 via Stockcharts.com:
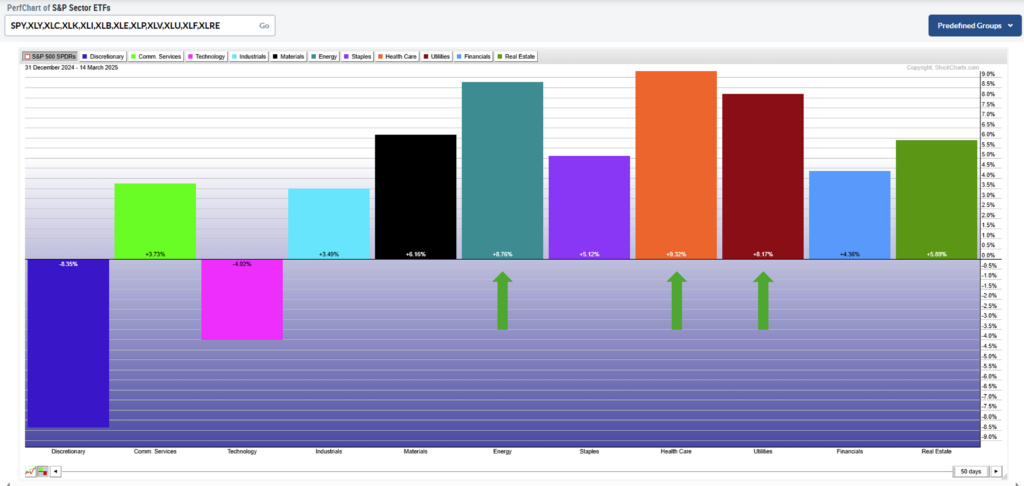
Lo and behold, energy, healthcare and utilities are at the top of the leaderboard again year to date.
At Cabana, we have incorporated all the data from 2022 into our system. CARA has now seen 2022 and should learn from those conditions when allocating assets today. My point here is that it is important to have a system – if it is robust and dynamic, all the better.
We are in currently in our Cautiously Bullish Scene with our Inflation Indicator Triggered.
Key term:
- The inflation indicator is a proprietary analytics measurement incorporated into CARA that seeks to identify the impact inflationary pressures are having on U.S. interest rates as evidenced by the yield of the ten-year treasury over the medium term.