Stocks Spent the Past Week Bouncing from Oversold Conditions: Market Commentary from Cabana’s CEO – October 16, 2023 

7 months ago

  • Share this:

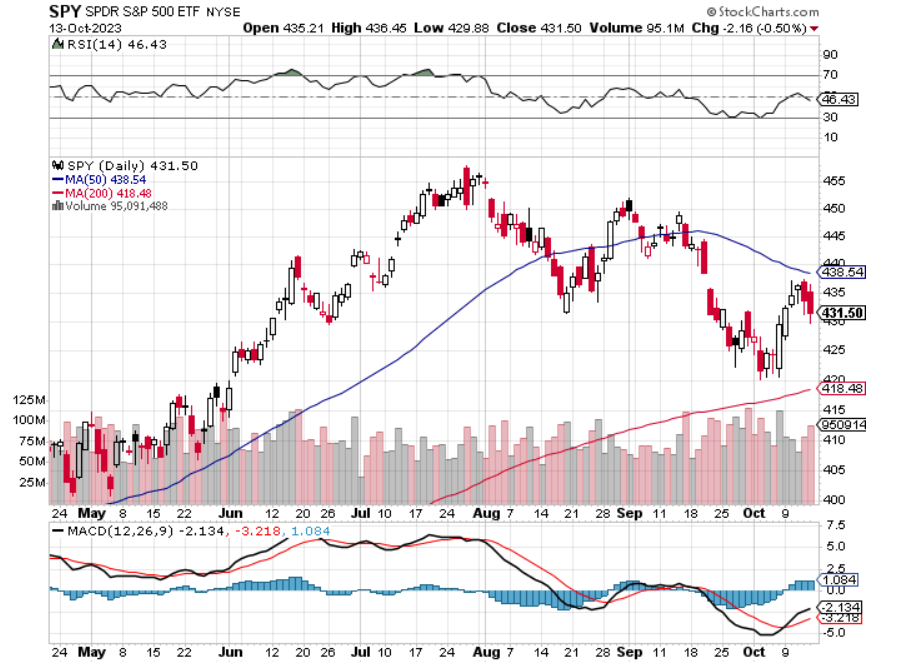
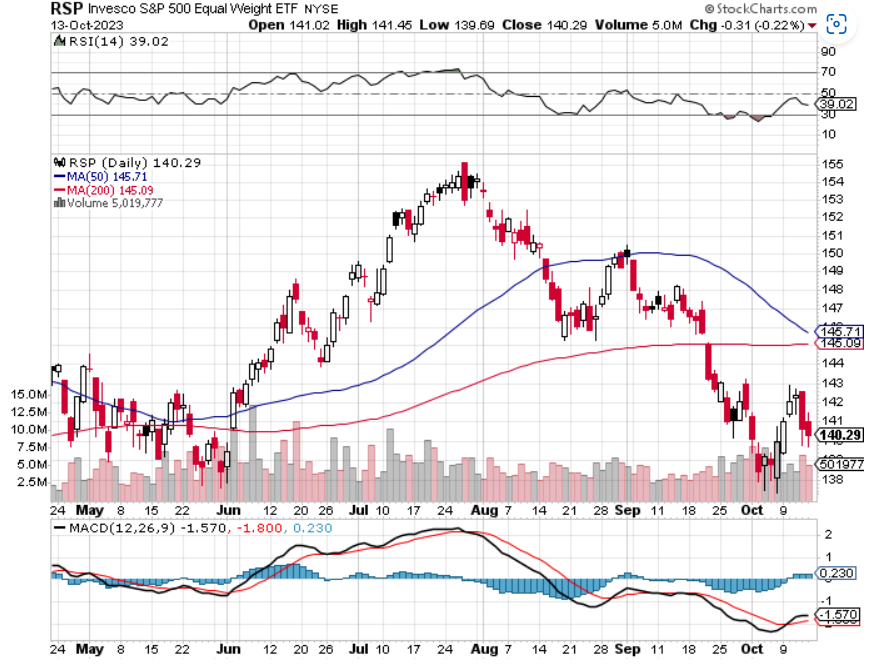
Stocks spent last week bouncing from oversold conditions that resulted from the pullback that began in August. The market-leading Nasdaq and cap-weighted S&P 500 found support just above their 200-day moving averages and, importantly, for the S&P 500 just above the important 420 level (SPY). I have included a six-month chart below for reference. The broader stock complex (RSP) found support at early summer lows, but well below both the 50- and 200-day moving average. I have included a chart of that as well. Nothing has changed, as big tech continues to be the only game in town. All other sectors are struggling and this needs to change in my opinion. 

The buying that we have seen during the past week has coincided with a drop in bond yields as predicted. Yields were extended and due for a pullback after the huge jump over the past six weeks. Traders stepped in and took advantage of a “coupled” trade and made some quick profits. Whether the last few days can lead to a more sustained rally leading into the year’s end remains to be seen. Quite a bit of technical damage has been done in multiple sectors. As I pointed out over the past few weeks, if support holds at that 420 level (SPY), I think we have a shot. 

It is difficult to adequately describe how unique this investment climate has been over the past eighteen months as bonds have been pummeled, with yields skyrocketing and stocks whipsawing, but not breaking. The yield curve remains significantly inverted and the Fed continues to withdraw liquidity from the system. By all historical accounts we should be in recession, yet the economy appears to remain robust, and the consumer keeps on spending. It is really amazing to me, and I wonder how future generations of investors will look back on these times.  

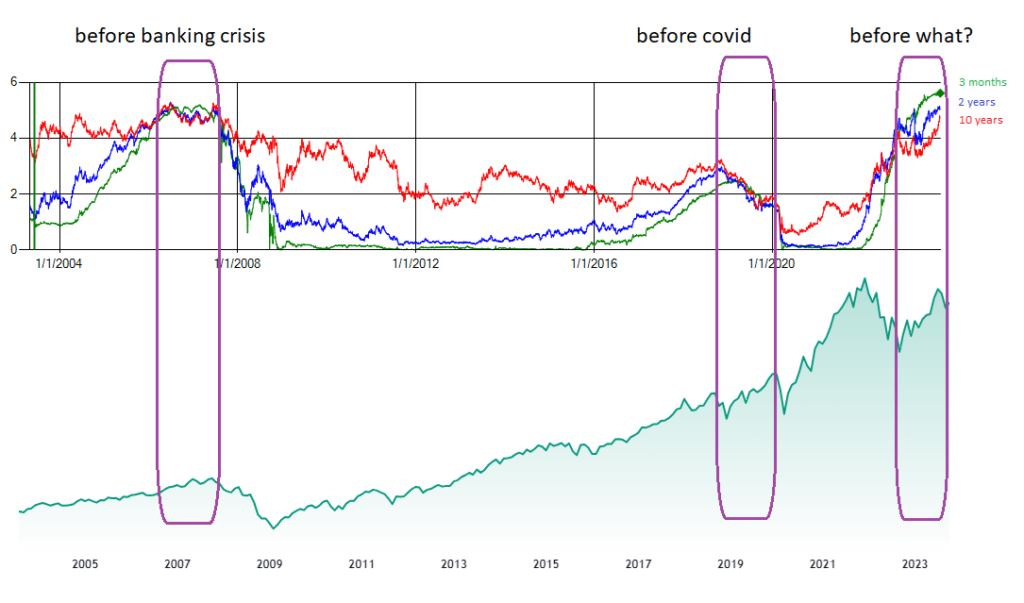
As many of you know, I believe the bond market usually sees things first and is where the smart money spends most of its time. That is why we watch the yield curve closely and why it is built into CARA (our Cyclical Asset Reallocation Algorithm) as a fundamental indicator. When the yield curve is inverted, bond investors are willing to tie up their money for longer periods of time for less return than if they loaned it out for shorter periods of time. This only makes sense if you believe interest rates are going to fall enough in the future for your payment on the long-term bond to be a lot more than will be available at the later date. Interest rates fall in times of economic weakness. This is why yield curve inversion historically has preceded recessions and bear markets. We have had the current inversion for some eighteen months but no economic weakness. So, what does this mean for the big picture going forward? That is the question. The final image below is a snapshot of our yield curve indicator in addition to the S&P 500 from 2007 until now. The red line (long term bonds) should be above the blue and green lines (short term bonds). This “normal” condition also coincides with bull markets, as you can see. Our chart shows three inversions, 2007, 2019 and current. The previous inversions ended with the financial crisis and the pandemic recession of 2020. Is 2024 going to bring something similar or is this time somehow different? I’ll let you decide for yourself.  

Earnings season kicked off on Friday and we will have more information on profits, the consumer and forecasts over the next few weeks. This will likely dictate whether we get a year-end rally before the 2024 question gets answered. 

We are in our Bearish Scene and in our Safety Valve positions in our Target Drawdown Portfolios as well as our Target Income Portfolio. Our Target Beta Portfolios are in their Bearish Scene allocations. 

SPY over the past six months from Stockcharts.com (as of 10/13/2023): 

RSP over the past six months from Stockcharts.com (as of 10/16/2023):  

Cabana’s Yield Curve Indicator (snapshot from CARA):

Disclaimers

January 17, 2024

This material is prepared by Cabana LLC, dba Cabana Asset Management and/or its affiliates (together “Cabana”) for informational purposes only and is not intended to be relied upon as a forecast, research or investment advice, and is not a recommendation, offer or solicitation to buy or sell any securities or to adopt any investment strategy. This material may only be distributed in its original format and may not be altered or reproduced without the prior written consent of CabanaThe opinions expressed reflect the judgement of the author, are as of the date of its publication and may change as subsequent conditions vary. The information and opinions contained in this material are derived from proprietary and nonproprietary sources deemed by Cabana to be reliable, are not necessarily all-inclusive and are not guaranteed as to accuracy. As such, no warranty of accuracy or reliability is given and no responsibility arising in any other way for errors and omissions (including responsibility to any person by reason of negligence) is accepted by Cabana, its officers, employees or agents.  

“CARA” is Cabana’s Cyclical Asset Reallocation Algorithm. Scenes assigned as per the judgment of The Cabana Group. Scene names and number of scenes have changed over time in an effort to obtain efficiencies and provide clarity of investment objective. 

This material may contain ‘forward looking’ information that is not purely historical in nature. Such information may include, among other things, projections and forecasts. There is no guarantee that any forecasts made will come to pass. Reliance upon information in this material is at the sole discretion of the reader. Past performance is not a reliable indicator of current or future results and should not be the sole factor of consideration when selecting a product or strategy. All investment strategies have the potential for profit or loss. All strategies have different degrees of risk. There is no guarantee that any specific investment or strategy will be suitable or profitable for a particular client. The information provided here is neither tax nor legal advice. Investors should speak to their tax professional for specific information regarding their tax situation. Investment involves risk including possible loss of principal.  

Cabana LLC, dba Cabana Asset Management (“Cabana”), is an SEC registered investment adviser with offices in Fayetteville, AR and Plano, TX. The firm only transacts business in states where it is properly registered or is exempted from registration requirements. Registration as an investment adviser is not an endorsement of the firm by securities regulators and does not mean the adviser has achieved a specific level of skill or ability. Additional information regarding Cabana, including its fees, can be found in Cabana’s Form ADV Part 2A or Form CRS. A copy of which is available upon request or online at www.adviserinfo.sec.gov/. 

Past performance is no guarantee of future results. All investment strategies have different degrees of risk and the corresponding potential for profit or loss. Asset allocation and diversification will not necessarily improve returns and cannot eliminate the risk of investment losses. “Target Drawdown” is merely a descriptive term used to describe the general strategy and objective of the portfolio, it is not a guarantee, nor should it be construed to suggest safety or protection from loss. There is no guarantee that portfolio performance will remain consistent with the targeted drawdown parameter. While risk tolerance and targeted “drawdown” are identified on the front end for each portfolio, Cabana’s algorithm does not take any one client’s situation into account and there is no guarantee that Cabana’s strategies will be suitable for any investor. Investors and advisors should not simply rely on the name of any portfolio to determine what is suitable. It is the responsibility of investment advisors to determine what is suitable for their clients. Cabana manages assets on multiple custodial platforms. Performance results for specific investors will vary based upon differences in associated costs and asset availability.  

Cabana claims compliance with the Global Investment Performance Standards (GIPS®). GIPS® is a trademark of the CFA Institute. The CFA Institute does not endorse or promote this organization, nor does it warrant the accuracy or quality of the content contained herein. To receive a GIPS Report and/or a firm’s list of composite/pooled fund descriptions please email your request to info@thecabanagroup.com.

All recommendations made in the prior 12 months are available upon request. Cabana’s allocation history is available here. For additional information regarding our services, including performance disclosures and award methodology, please visit https://thecabanagroup.com/disclaimers/. 

Commonly used index/benchmark definitions:  

All indices and categories are unmanaged and an individual cannot invest directly in an index or category. Index returns do not include fees or expenses. Benchmark indices will likely materially differ from Cabana’s portfolio strategies. Detailed information as to how the returns are calculated can be obtained online from the following link: https://thecabanagroup.com/disclaimers/performance-reporting-methodology/. 

Morningstar’s Moderate Target Risk index  follows a moderate equity risk preference and is based on well-established asset allocation methodology from Ibbotson Associates, a Morningstar company.  

Morningstar’s Tactical Allocation category includes portfolios that seek to provide capital appreciation and income by actively shifting allocations across investments. These portfolios have material shifts across equity regions, and bond sectors on a frequent basis. 

The S&P 500 Index is a market-capitalization weighted stock market index of 500 widely held large-cap stocks often used as a proxy for the U.S. stock market.  

The Russell 2000 and 3000 indices are market-capitalization weighted stock market indices that include, respectively, 2000 and 3000 of the most widely-held stocks and are often used as proxies for the U.S. stock market. 

The Nasdaq Composite Index is a market-weight capitalization index that covers more than 3,000 stocks listed on the Nasdaq Stock Market. What is the Nasdaq Composite, and What Companies are in It? | Nasdaq