Below is a snapshot of last week’s market performance and what to watch in the weeks ahead from Chadd Mason, Cabana CEO and co-founder.
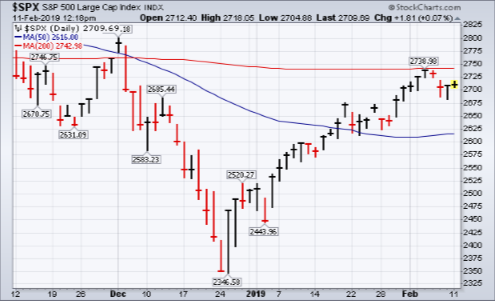
We have pointed out in recent comments that U.S. equity markets are at a critical juncture following the January rebound. All major indexes are hovering right at the 200-day moving average. At this point, the Dow is the only one to have cleared it and is now resting on it after losing some ground last week. The broader S&P 500 has not been able to trade above it and has also fallen back. See the charts below.
Why is the 200-day moving average important?
Over the past several weeks, I have received some questions about the importance of the 200-day moving average and would like to provide some backstory. First, this area of historical price is reflective of a medium-term price trend. If an index is above the 200-day average it is considered to be in a medium-term uptrend, which is bullish. This is especially relevant when looking at the S&P 500, as it is often used as a proxy for the U.S. equity market in general. Many institutional investors have policies that consider this and are required to deploy capital into equities when the S&P 500 moves above it or in other words, resumes its uptrend. Conversely, these same investors sell equities when the index falls below it. Institutional investors make up a huge segment of our markets. When they move in or out price is impacted profoundly. Secondly, as a result of the phenomena outlined above, this area of technical demarcation is a point of major supply and demand. Stock shares are purchased when indexes move above and bounce off of the 200-day moving average. During a cyclical bull market, there are many occasions during corrections or pullbacks when the 200-day moving average acts as support during a prolonged uptrend. Investors know this and see an opportunity to buy in at cheaper prices when a correction occurs, and indexes pull back to the 200-day average. A large number of shares are then bought at that level. Sometimes those investors are wrong, having bought at that level and/or having held stocks all the way down, only to see the 200-day moving average fail to hold the correction or pullback. This is what happens at the beginning of bear markets. Those previously smart investors are now stuck holding losing positions and are dying to see prices bounce back to their breakeven levels, so that they can get out without significant losses. So, then what happens? This process results in an overabundance of supply becoming available around the 200-day price level. When there is more supply (sellers than buyers), prices go down. This is Economics 101. This makes it difficult to overcome the 200-day moving average when it has been significantly breached. It also makes it that much more important when it is reclaimed. I hope this short summary is helpful. Please let us know if you have questions or would like further explanation.
What now?
While we watch the 200-day moving average battle U.S. equity indexes, it is helpful to look at other asset classes for hints as to how the fight will turn out. The U.S. dollar is approaching two-year highs against other currencies. This reflects relative strength in the U.S. economy compared to other countries, and a flight to safety. In times of uncertainty, investors want the safest of assets.
- A strong U.S. dollar puts pressure on commodities, foreign economies and large multinational corporations that sell products around the world. In my opinion, a strong dollar at this point in our economic cycle is not a bullish sign.
- Gold is also outperforming other assets. Gold is a risk off asset. Gold doesn’t pay a dividend and you can’t eat it. What it does do is provide a rock-solid store of value when things get ugly. Gold outperformance right now is also not a bullish sign… in my opinion.
Finally, earnings have been spotty over the past few weeks. Companies aren’t reporting growth at the levels we saw this time last year. More importantly, their forecasts are starting to show some cracks. A trade deal with China and continued dovishness by our Federal Reserve would go a long way to righting this teetering market.
The daily bars in Chart 1 below show the Dow Industrials trying to stay above their red line at 25009. So far, the Dow has been the only major stock index to cross over that line, but it’s struggling to hold that upside breakout. Chart 2 shows the S&P 500 backing off from its red line last week.
Source: Stockcharts.com
Chart 1:
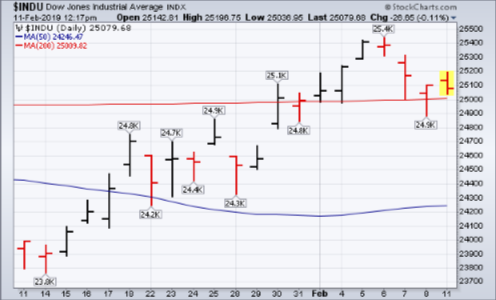
Chart 2:
Download a PDF of this week’s market commentary at the following link: Weekly Market Commentary February 11 2019